


Mobile apps have become an integral part of our daily lives, and businesses are increasingly relying on them to engage users and drive revenue. To ensure the success of your mobile app, it’s essential to track and analyze various metrics. These key metrics provide valuable insights into user behavior, app performance, and areas for improvement.
In this article, we’ll explore the top mobile app metrics that every app developer and marketer should track to optimize their app’s performance and user experience.
1. App Downloads

App downloads serve as a critical initial indicator of your app’s appeal and the reach of your marketing efforts. This metric directly reflects the number of users who have taken the first step in engaging with your app by installing it on their devices. By tracking app downloads, you gain valuable insights into the effectiveness of your user acquisition strategies. Steady growth in downloads suggests that your marketing campaigns, app store optimization, and promotional efforts are resonating with your target audience. Conversely, periods of declining downloads may signal the need for adjustments in your marketing approach or improvements to your app’s visibility and value proposition in the app stores.
Moreover, analyzing app download trends over time provides a historical perspective that can guide your decision-making. It allows you to pinpoint when your app experienced surges in popularity or drops in user acquisition. Armed with this information, you can delve deeper into what contributed to these trends, whether it was a successful marketing campaign, seasonal fluctuations, or changes in market dynamics. This data-driven approach empowers you to adapt your strategies accordingly, focusing on areas that drive growth and addressing issues during periods of decline, ultimately optimizing your app’s performance and user acquisition efforts.
2. User Retention Rate

User retention rate is a vital mobile app metric that provides insights into the long-term sustainability and appeal of your application. It signifies the percentage of users who continue to engage with your app over a specified period, such as days, weeks, or months, after their initial download. A high retention rate is a clear indicator that your app delivers consistent value and a positive user experience, as users keep returning. Monitoring retention rates at various time intervals, such as 7-day, 30-day, or even 90-day retention, is essential to understanding user behavior and pinpointing when drop-offs typically occur. By segmenting this data, you can identify critical points in the user journey where improvements or targeted interventions may be necessary to enhance user satisfaction and loyalty.
Analyzing retention metrics not only helps you identify potential user churn but also provides actionable insights into user engagement patterns. It allows you to recognize which features or content resonate most with your audience, helping you refine your app’s user experience. Moreover, understanding when users are most likely to drop off can guide your re-engagement strategies and personalized messaging efforts to keep users actively involved with your app. In essence, a solid retention rate signifies not just a one-time attraction but an ongoing relationship between users and your app, contributing to its long-term success and growth.
3. Daily Active Users (DAU) and Monthly Active Users (MAU)

Daily Active Users (DAU) and Monthly Active Users (MAU) are fundamental metrics in mobile app analytics that offer valuable insights into user engagement and the overall performance of your app. DAU measures the number of unique users who interact with your app on a daily basis, providing a real-time snapshot of daily activity. On the other hand, MAU represents the count of unique users who engage with your app within a calendar month. Together, these metrics give you a clear picture of user engagement patterns over both short-term and longer-term periods.
Tracking DAU and MAU is crucial because they serve as foundational metrics that underpin the assessment of your app’s health and user activity. By examining these metrics over time, you can identify trends, seasonality, and potential fluctuations in user engagement. A growing DAU and MAU typically signify a healthy and active user base, while declines may signal retention challenges or a need to re-engage users. Moreover, DAU and MAU metrics serve as a basis for calculating other key performance indicators (KPIs) and conversion rates, helping you measure the effectiveness of your user acquisition and engagement strategies. Overall, these metrics empower you to make data-driven decisions and refine your app’s strategies for sustained growth and user satisfaction.
4. Session Length and Frequency

Session metrics are essential components of mobile app analytics, offering insights into user behavior and engagement patterns. These metrics encompass two key aspects: session frequency and session duration. Session frequency measures how often users open your app, indicating how frequently they find value in its content or functionality. Higher session frequency suggests that users are actively engaging with your app, returning regularly for its benefits. On the other hand, session duration measures the amount of time users spend within your app during each session. Longer session durations are typically indicative of deeper user engagement, as users explore your app’s features or content for an extended period.
Analyzing session metrics can help you gauge the overall appeal and utility of your app to users. A higher session frequency suggests that users find your app useful and relevant to their needs, encouraging repeat visits. Longer session durations indicate that users are invested in your app’s content or functionality, which can be especially valuable for apps with advertising or in-app purchase revenue models. Conversely, if session metrics show low frequency and short durations, it may indicate a need to improve the user experience or provide more engaging content to retain users. By tracking these session-based metrics, you can refine your app’s features, content, or marketing strategies to boost user engagement and satisfaction, ultimately contributing to the app’s success.
5. User Engagement Metrics

User engagement metrics are a critical aspect of mobile app analytics, providing insights into how effectively your app captures and maintains user interest. These metrics encompass various user interactions within your app, such as likes, shares, comments, or any actions relevant to your app’s purpose. The goal is to gauge the depth of user engagement, as it reflects how actively users participate and interact with your app. High levels of engagement signify that users are finding value, satisfaction, and relevance in your app’s content or functionality.
To measure user engagement, you can track specific actions that users take, such as sharing content, leaving comments, or completing in-app tasks. These interactions provide valuable feedback on the user experience and content quality. Additionally, tracking engagement metrics over time allows you to identify trends and patterns, helping you understand which aspects of your app resonate most with users and which may require improvement. By actively monitoring and optimizing user engagement metrics, you can foster a more loyal and involved user base, ultimately enhancing the success and longevity of your mobile app.
6. Conversion Rate

The conversion rate is a pivotal mobile app metric that quantifies the success of your app in driving users to complete specific actions or goals. These actions could vary from making a purchase and signing up for a newsletter to filling out a contact form or completing a level in a gaming app. Measuring conversion rates is essential because it provides insights into the effectiveness of your app’s user experience and marketing strategies. It enables you to determine whether users are taking the desired steps within your app and, more importantly, whether they are converting into valuable customers or engaged users.
Analyzing conversion rates can uncover potential bottlenecks or friction points in your app’s user journey. For instance, if you observe a high number of users initiating a purchase but abandoning it at the checkout stage, it signals a need for optimization in the payment process or possibly adjustments to pricing or incentives. By closely monitoring conversion rates and experimenting with improvements based on your findings, you can enhance the user experience, boost user engagement, and ultimately drive more favorable outcomes, whether it’s increased revenue, higher subscriber counts, or improved lead generation.
7. Churn Rate

Churn rate is a critical mobile app metric that reveals the percentage of users who discontinue using your app within a defined period, such as a month or a year. A high churn rate can be a concerning sign, suggesting that your app may be facing challenges related to its value proposition, user onboarding process, or the overall user experience. Understanding and mitigating churn is of paramount importance for the long-term success and sustainability of your app.
A high churn rate could result from various factors, such as user dissatisfaction with your app’s features, a lack of engagement, or technical issues that hinder the user experience. To address this, it’s crucial to analyze the specific points in your app’s user journey where users are dropping off and determine potential reasons for their departure. By pinpointing these pain points and implementing targeted improvements, you can enhance user satisfaction, encourage retention, and ensure that your app remains a valuable and indispensable part of users’ digital lives. Reducing churn not only helps maintain a loyal user base but also supports sustainable growth and revenue generation for your app over time.
8. Revenue Metrics

Revenue metrics are of paramount importance for mobile apps that employ monetization strategies. These metrics encompass key indicators such as Average Revenue Per User (ARPU), Average Transaction Value (ATV), and Customer Lifetime Value (CLV), offering valuable insights into your app’s financial performance and guiding your monetization strategy.
Average Revenue Per User (ARPU) provides a measure of the average revenue generated by each user of your app. It is a critical metric for understanding the financial impact of your app and assessing its effectiveness in generating revenue. Tracking ARPU over time can help you identify trends, such as periods of increased or decreased user spending, and tailor your monetization efforts accordingly. Additionally, ARPU can provide insights into the success of specific user segments, allowing you to refine your marketing and user engagement strategies for maximum profitability.
9. App Store Ratings and Reviews
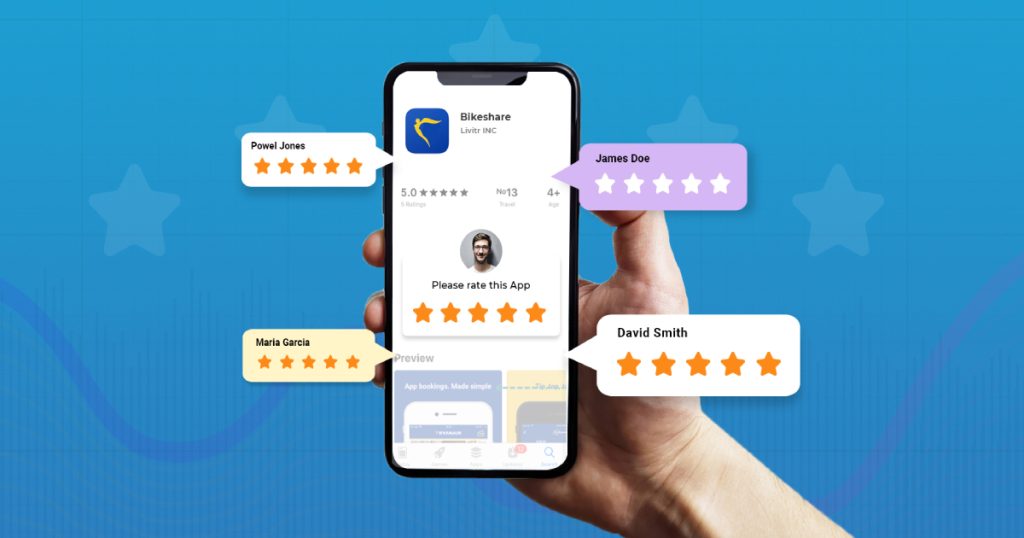
Monitoring app store ratings and reviews is an integral part of maintaining a healthy and user-friendly mobile app. These user-generated assessments provide a direct window into user sentiment and feedback. Positive reviews not only serve as a source of pride but also contribute to bolstering your app’s reputation and attracting new users. They can act as powerful endorsements, signaling to potential users that your app delivers value and satisfaction.
On the flip side, negative reviews are equally crucial, as they offer insights into areas that may require attention and improvement. They can highlight specific pain points, bugs, or usability issues that users have encountered. By carefully analyzing negative reviews, you can identify common trends or recurring problems and take proactive steps to address them. This responsiveness to user feedback demonstrates your commitment to enhancing the user experience, which can help retain existing users and win back those who may have been discouraged by past issues. Moreover, engaging with users through app store responses showcases your dedication to listening to your audience, fostering trust, and building a loyal user base over time.
10. Crash Reports and Performance Metrics

Keeping a close eye on app crashes and performance issues is paramount for ensuring a positive user experience. In today’s competitive app landscape, users have little patience for applications that frequently crash or exhibit sluggish performance. A single negative experience can lead to uninstalls and deter users from returning. To maintain a satisfied user base, it’s essential to regularly review crash reports and performance metrics. These insights provide you with a clear understanding of where and when issues occur, allowing you to pinpoint technical glitches or bottlenecks that need immediate attention.
By identifying and resolving crashes and performance issues promptly, you not only prevent user frustration but also enhance your app’s reputation and reliability. Users are more likely to engage with an app they trust to work smoothly and reliably. Moreover, a stable app experience encourages users to spend more time within your app, increasing their engagement and potentially driving higher conversion rates. This proactive approach to monitoring and improving app performance is an integral part of maintaining user satisfaction and ensuring the long-term success of your mobile application.
Top Mobile App Analytics Tools
- Google Analytics for Mobile: Google Analytics is a comprehensive analytics tool that offers detailed insights into user behavior, acquisition channels, and user demographics. It’s particularly useful for tracking user interactions within your mobile app.
- Flurry Analytics: Flurry, owned by Verizon Media, provides detailed analytics for mobile apps, including user retention, engagement, and demographics. It’s known for its real-time reporting and robust event tracking capabilities.
- Mixpanel: Mixpanel is a user analytics platform that focuses on user engagement and retention. It allows you to track user interactions, create funnels, and run A/B tests to optimize your app’s performance.
- Amplitude: Amplitude is another user analytics tool that specializes in helping businesses understand user behavior. It offers features like cohort analysis, behavioral segmentation, and predictive analytics.
- Firebase Analytics: Firebase Analytics is part of Google’s Firebase platform and is designed specifically for mobile apps. It provides real-time insights into user behavior, app performance, and crash reporting. Firebase Analytics is particularly popular among app developers using Firebase as their backend.
Final Thoughts
In conclusion, tracking these top mobile app metrics provides the data needed to make informed decisions, improve user experience, and drive the success of your app. By continuously monitoring and optimizing these metrics, you can enhance user engagement, boost retention, and maximize the value your app provides to both users and your business.
Remember that the specific metrics you focus on may vary depending on your app’s goals and industry, so tailor your analytics strategy accordingly.
If you’re considering creating or enhancing your mobile app, feel free to contact us for assistance.